
File:Transcriptomes heatmap example.svg

此SVG文件的PNG预览的大小:454 × 600像素。 其他分辨率:182 × 240像素 | 363 × 480像素 | 581 × 768像素 | 775 × 1,024像素 | 1,550 × 2,048像素 | 483 × 638像素。
原始文件 (SVG文件,尺寸为483 × 638像素,文件大小:502 KB)
摘要
| 描述 |
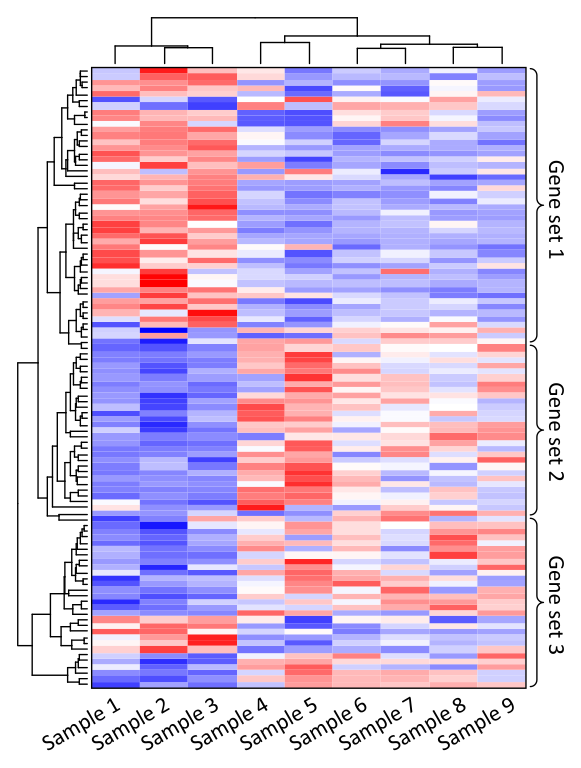
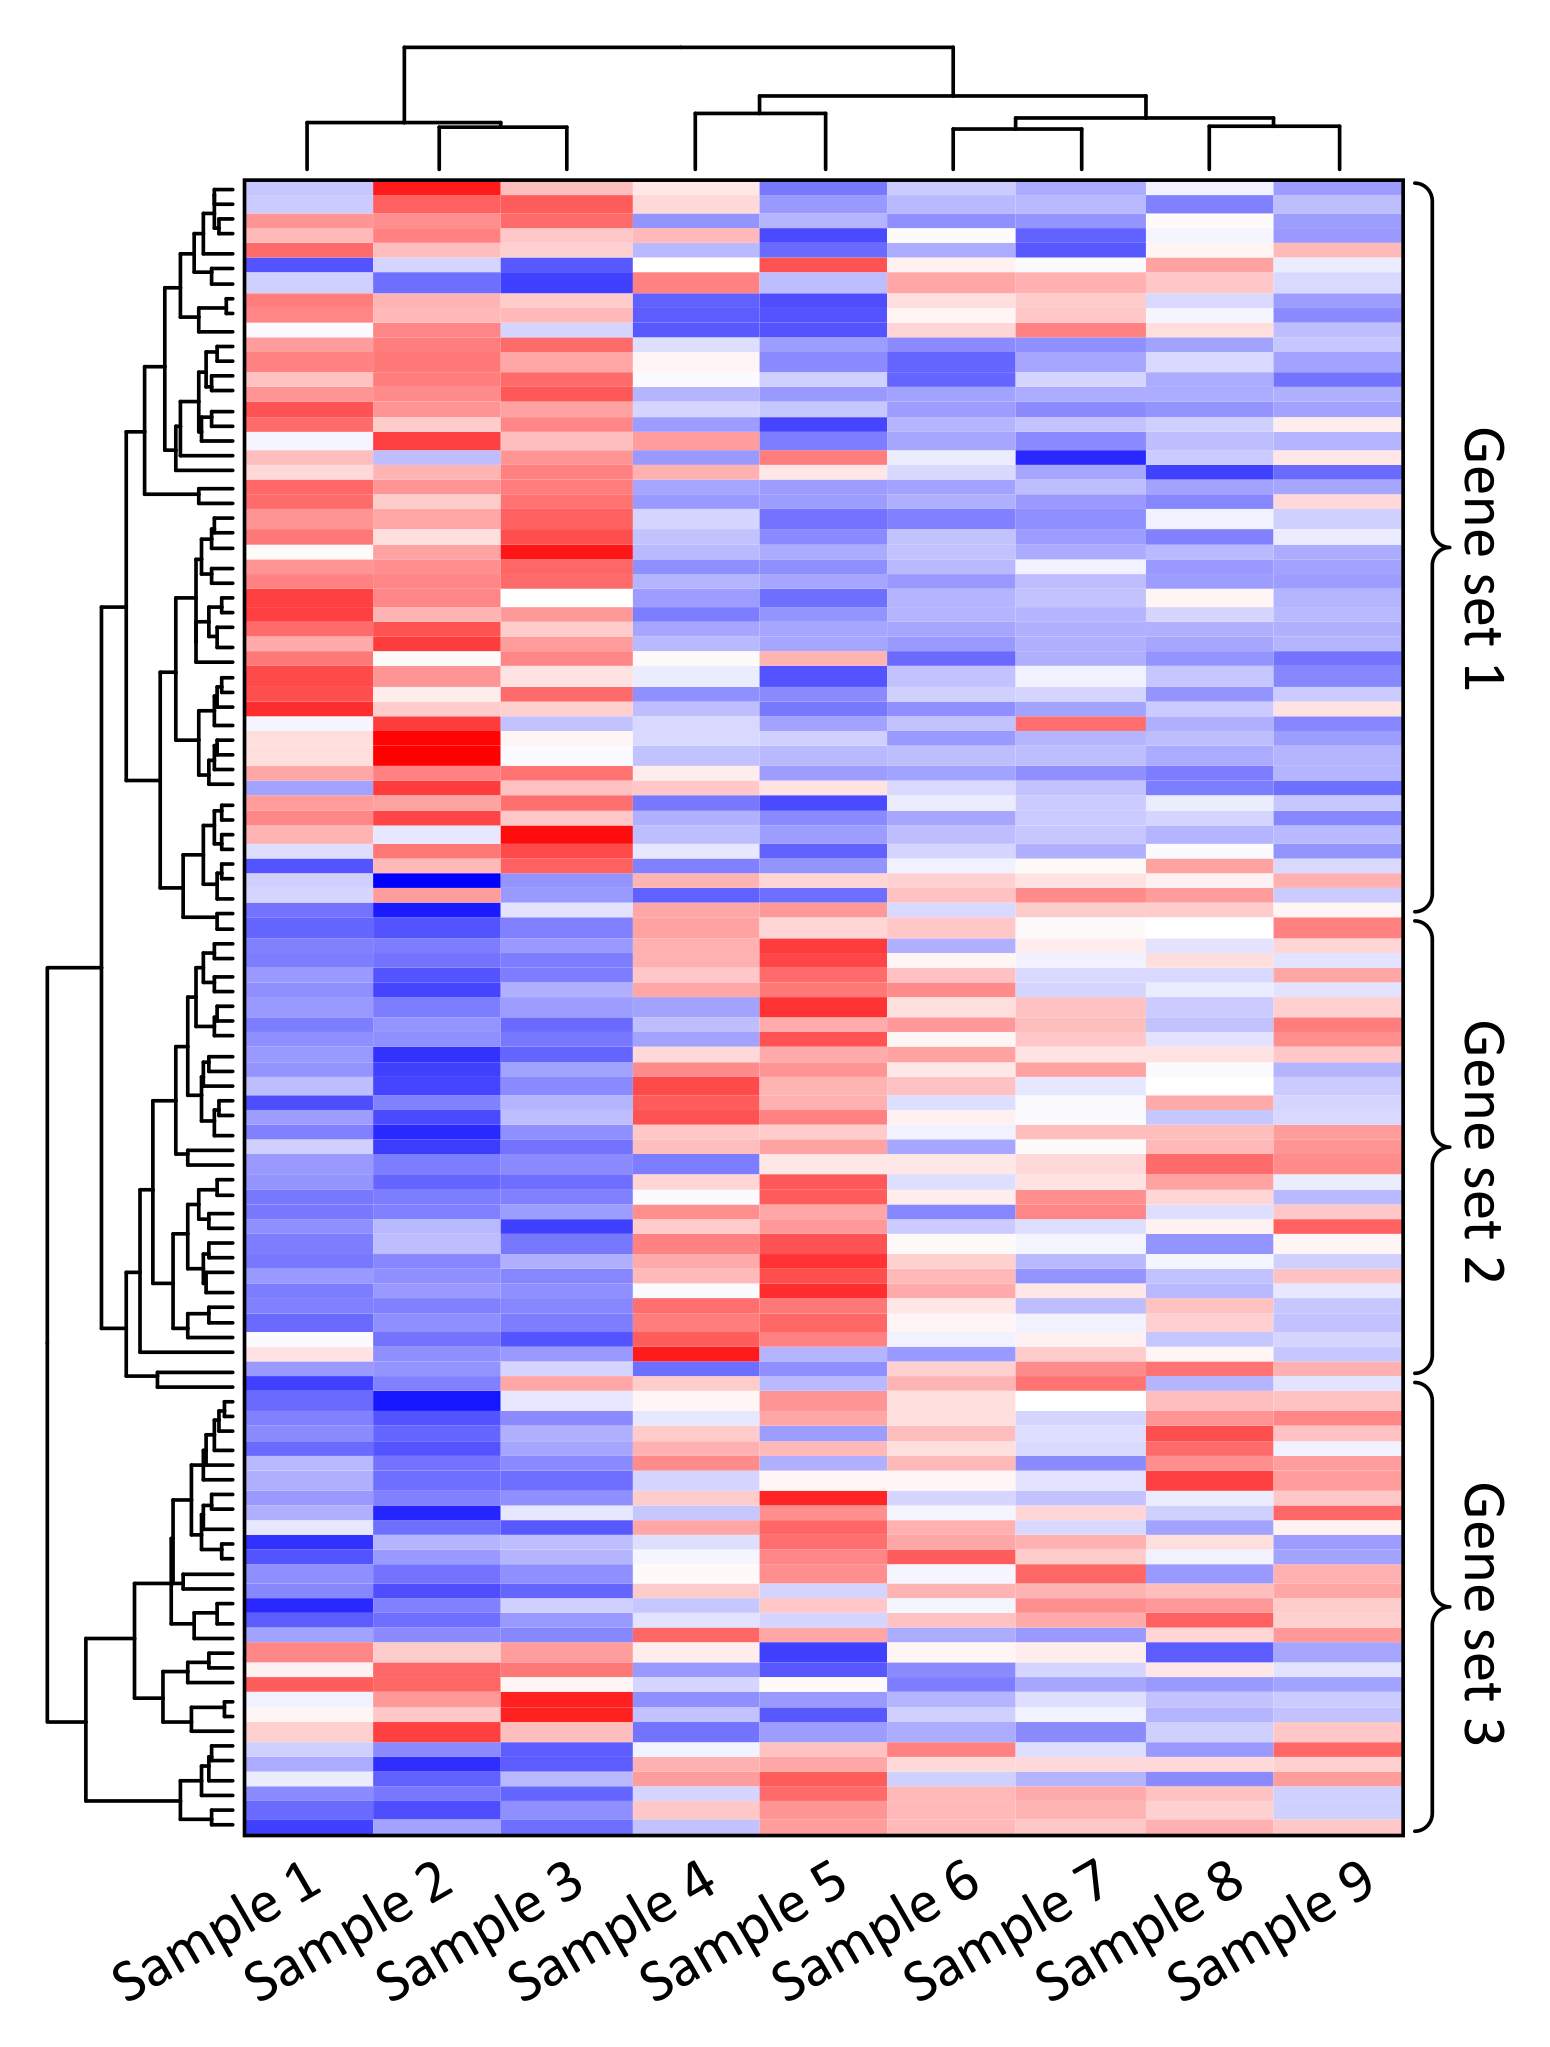
English: Heatmap identification of gene co-expression patterns across different samples. Each column contains the measurements for gene expression change for a single sample. Relative gene expression is indicated by colour: high-expression (red), median-expression (white) and low-expression (blue). Genes and samples with similar expression profiles can be automatically grouped (left and top trees). Samples may be different individuals, tissues, environments or health conditions. In this example, expression of gene set 1 is high and gene set 2 is low in samples 1, 2, and 3. |
| 日期 | |
| 来源 | 自己的作品 |
| 作者 | Thomas Shafee |
许可协议
我,本作品著作权人,特此采用以下许可协议发表本作品:
文件历史
点击某个日期/时间查看对应时刻的文件。
| 日期/时间 | 缩略图 | 大小 | 用户 | 备注 | |
|---|---|---|---|---|---|
| 当前 | 2017年3月10日 (五) 02:38 | | 483 × 638(502 KB) | Evolution and evolvability | slight line edits |
| 2017年3月10日 (五) 02:37 |  | 483 × 638(502 KB) | Evolution and evolvability | outline | |
| 2017年3月10日 (五) 01:27 |  | 483 × 638(502 KB) | Evolution and evolvability | white background, slightly larger text | |
| 2017年3月10日 (五) 01:08 |  | 574 × 744(461 KB) | Evolution and evolvability | User created page with UploadWizard |
文件用途
没有页面使用本文件。
全域文件用途
以下其他wiki使用此文件:
- ar.wikipedia.org上的用途
- en.wikipedia.org上的用途
- en.wikiversity.org上的用途
- es.wikipedia.org上的用途
- nl.wikipedia.org上的用途
- ru.wikipedia.org上的用途