
File:Transcriptomes heatmap example.svg

此 SVG 檔案的 PNG 預覽的大小:454 × 600 像素。 其他解析度:182 × 240 像素 | 363 × 480 像素 | 581 × 768 像素 | 775 × 1,024 像素 | 1,550 × 2,048 像素 | 483 × 638 像素。
原始檔案 (SVG 檔案,表面大小:483 × 638 像素,檔案大小:502 KB)
摘要
| 描述 |
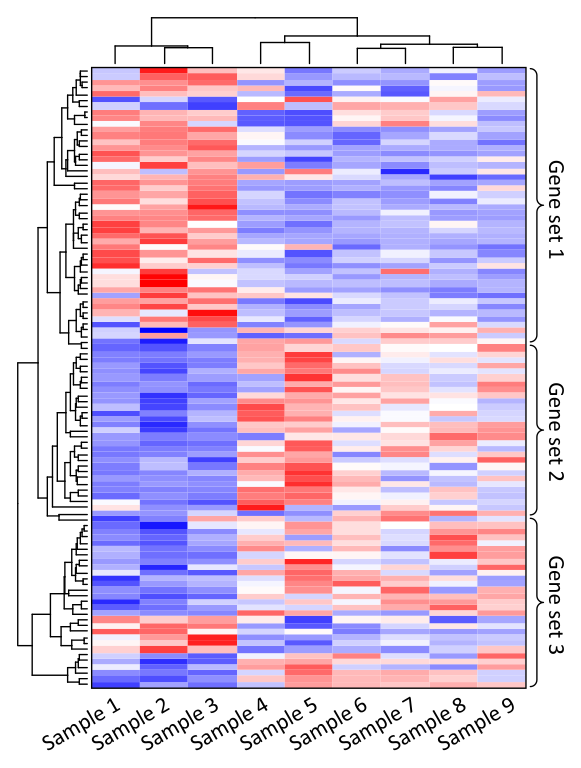
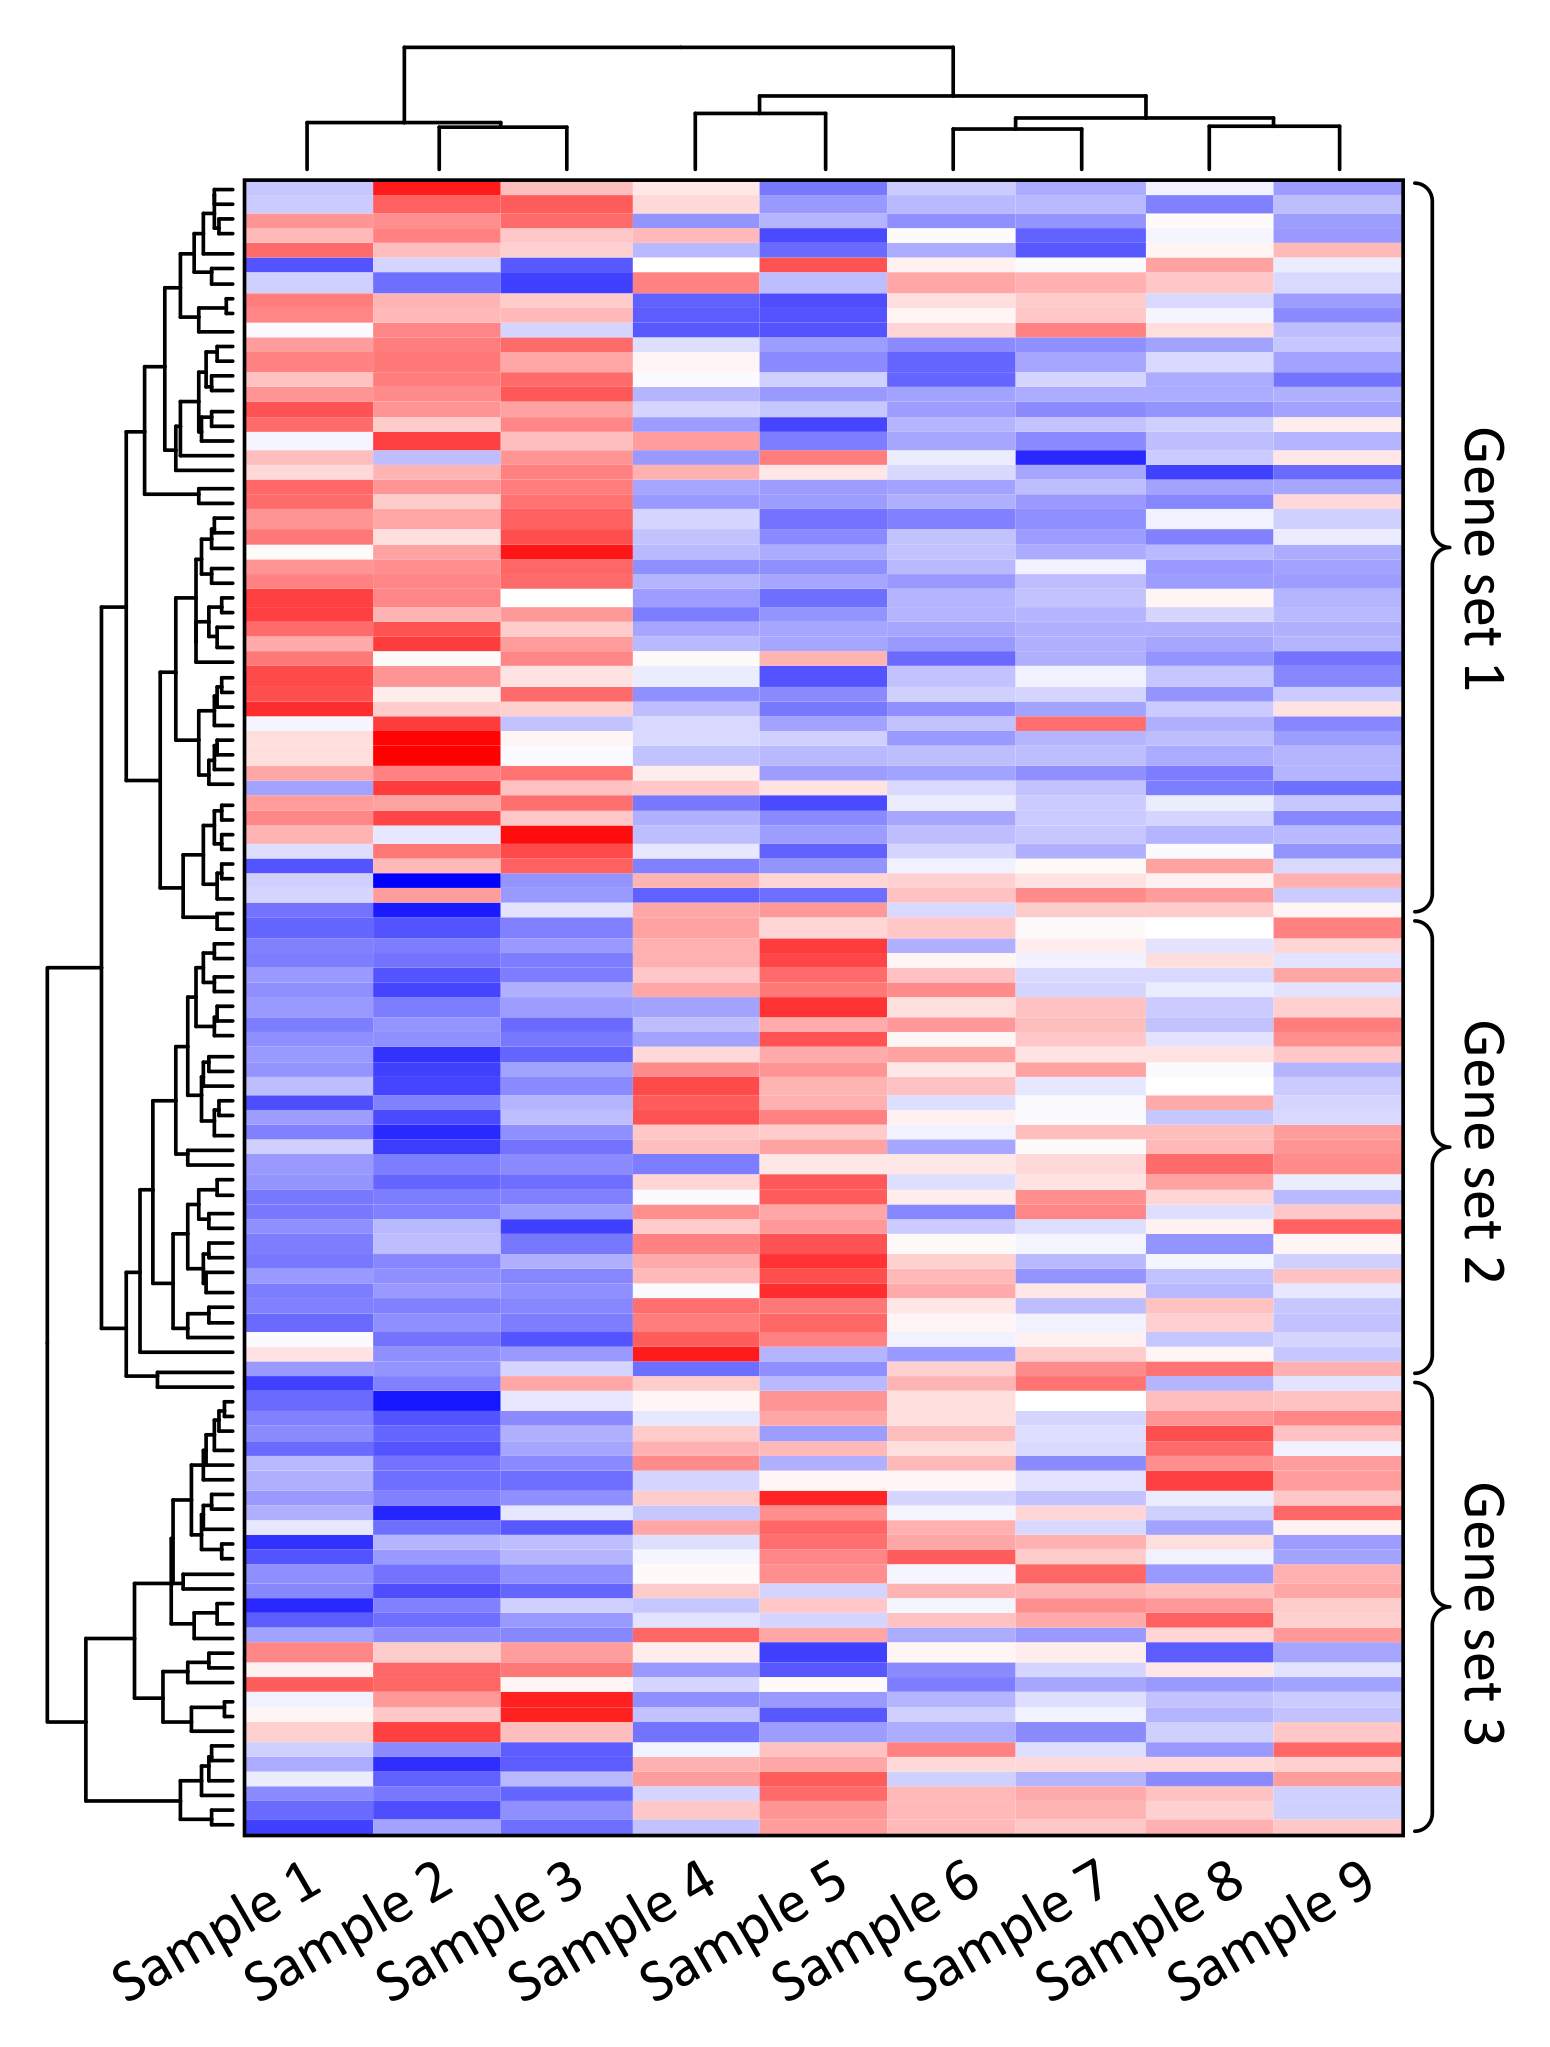
English: Heatmap identification of gene co-expression patterns across different samples. Each column contains the measurements for gene expression change for a single sample. Relative gene expression is indicated by colour: high-expression (red), median-expression (white) and low-expression (blue). Genes and samples with similar expression profiles can be automatically grouped (left and top trees). Samples may be different individuals, tissues, environments or health conditions. In this example, expression of gene set 1 is high and gene set 2 is low in samples 1, 2, and 3. |
| 日期 | |
| 來源 | 自己的作品 |
| 作者 | Thomas Shafee |
授權條款
我,本作品的著作權持有者,決定用以下授權條款發佈本作品:
此檔案採用創用CC 姓名標示 4.0 國際授權條款。
- 您可以自由:
- 分享 – 複製、發佈和傳播本作品
- 重新修改 – 創作演繹作品
- 惟需遵照下列條件:
- 姓名標示 – 您必須指名出正確的製作者,和提供授權條款的連結,以及表示是否有對內容上做出變更。您可以用任何合理的方式來行動,但不得以任何方式表明授權條款是對您許可或是由您所使用。
檔案歷史
點選日期/時間以檢視該時間的檔案版本。
| 日期/時間 | 縮圖 | 尺寸 | 使用者 | 備註 | |
|---|---|---|---|---|---|
| 目前 | 2017年3月10日 (五) 02:38 | | 483 × 638(502 KB) | Evolution and evolvability | slight line edits |
| 2017年3月10日 (五) 02:37 |  | 483 × 638(502 KB) | Evolution and evolvability | outline | |
| 2017年3月10日 (五) 01:27 |  | 483 × 638(502 KB) | Evolution and evolvability | white background, slightly larger text | |
| 2017年3月10日 (五) 01:08 |  | 574 × 744(461 KB) | Evolution and evolvability | User created page with UploadWizard |
檔案用途
沒有使用此檔案的頁面。
全域檔案使用狀況
以下其他 wiki 使用了這個檔案:
- ar.wikipedia.org 的使用狀況
- en.wikipedia.org 的使用狀況
- en.wikiversity.org 的使用狀況
- es.wikipedia.org 的使用狀況
- nl.wikipedia.org 的使用狀況
- ru.wikipedia.org 的使用狀況